Empower Data Citizens to run data experiments at scale and build insightful stories

What is data-democratisation?

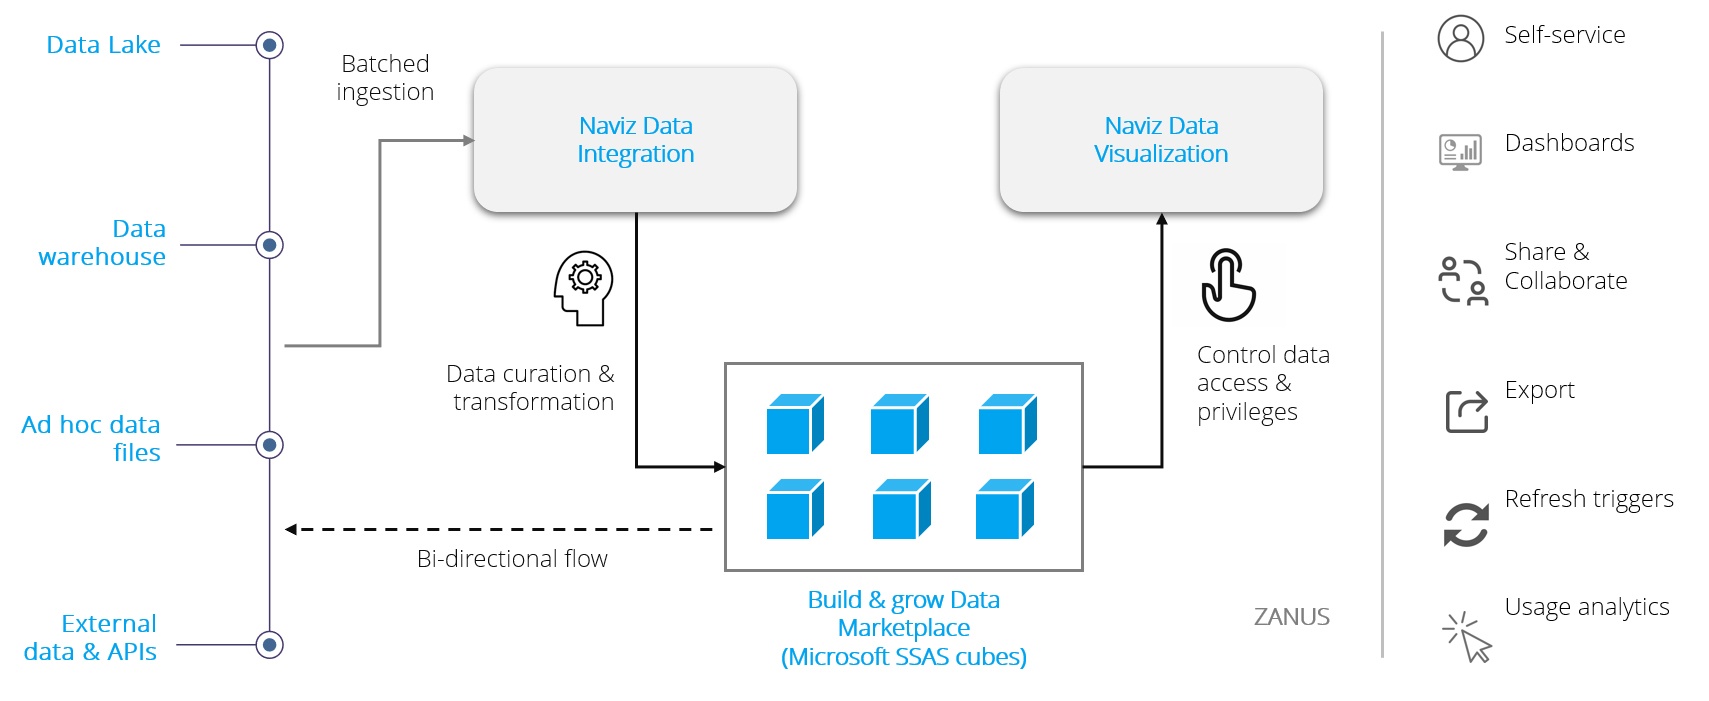
Data democratization means that everybody has access to data and there are no gatekeepers that create a bottleneck at the gateway to the data. It requires that we accompany the access with an easy way for people to understand the data so that they can use it to expedite decision-making and uncover opportunities for an organization. The goal is to have anybody use data at any time to make decisions with no barriers to access or understanding.

Bernard Marr,

Data & AI Influencer, Speaker, Advisor

Data Democratization – Our approach

Build persona

Understand how the data is consumed across various levels

Data curation

Curate the data for ease of use, quality, and understandability

Access framework

Define a simple access framework

Self-service toolkit

Provision a self-service data/BI tool for non-technical users

Data Storytelling

Evangelize the use of data and promote data-driven experimentation

Data Citizens – the new “Data” tribe

“Citizen” data is the term coined by Gartner. “Power users” who can perform both simple and moderately sophisticated analytical tasks that would previously have required more expertise

What Data Citizens need?

Self-service and easy-to-use toolkit for “data” storytelling

Marketplace of
quality data sets

Collaborate
with the peers

Impact of Data Citizens

Empower domain experts with no-code platforms

Scale up data-driven experimentation

Free up data experts from small data needs

Empowering Data Citizens to explore data at their comfort and narrate insightful stories

Offers no-code platform for smart data visualization and easy data integration

Available as SaaS offering and on-premise setup. Central provisioning enables thin client access for “data-lovers” community

Custom fits the data ecosystem by reading cross-organizational data and building data marketplace via cubes

Composable and flexible components for Data Integration and Data Visualization

ZANUS – Data Democratization Platform

ZANUS – Data Visualization & Data Integration

Visualize organization's raw data to generate actionable insights.

Explore the data and uncover deep insights by visualizing raw data from across data systems in your organization.

Achieve faster page load times for millions of rows with real-time views of data.

Visualize and track your KPIs on any device from anywhere.

Monitor correlations, summaries and more, further giving you automatic insights

Configure alerts and thresholds on business KPIs. Usage analytics to advocate data features

Integrate, merge, and access your data as a hub across all your systems

Leverage low-code interface to connect live data from disparate data platforms, on-prem or cloud, using 1000+ prebuilt connectors.​

Query data directly from with data federation, so your sensitive data doesn’t need to leave the firewall.

Combine and enhance data from multiple sources and visually sequence them without SQL expertise.

Keep your data current by making use of the default logical application every time your dataset is updated.

Data cleansing, transformation, and mining can be achieved during integration

Covid -19 Dashboard

Covid-19 Worldwide Statistics such as confirmed cases vs recovery rate vs death rates? Social Distancing: Stay Home, Stay Safe & Protect Others